Explore

Analysis of Network Graphs: Visualizing Hamilton Characters as a Social Network

The article delves into using graph theory to visualize complex character networks in literature, using examples...

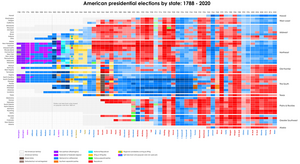
This is the Historigraph. It can bring advanced data visualization to the mainstream.

The line between a historigraph like the USA elections example, and a correlation-sorted time-series heat map...


How Custom Data Models Drive Next-Generation Embedded Analytics
Custom data models play a crucial role in embedded analytics, offering flexibility and scalability for SaaS...

Power BI: Two ways to Union Tables - DAX and Power Query
Combining data from multiple tables is a common requirement in Power BI. There are two primary...
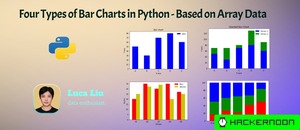
Four Types of Array Data-Based Bar Charts in Python
import matplotlib.pyplot as plt, numpy as numpy, data as data. Data.Data (men, women, men, women) =...


Five Simple Steps to Convert Dashboard Charts Into PDFs
Learn to quickly export dashboard charts to PDF using jsPDF with a few lines of JavaScript...